A curve is a relationship between the timing of a fade and the output level of a cue, cue part or dimmer at each point of time during that fade. By using a non-linear curve, you can create of variety of effects, accommodate variations and deficiencies in your lighting equipment, alter the transition ramp and protect equipment from stress.
You may apply curves to dimmers in patch. Curves may also be applied to cues, to cue parts, and to scroller fans. When applied to a cue, the curve impacts only the intensity moves in that cue. When applied to a cue part, the curve impacts all parameter moves stored in that cue part.
When applied in patch, the intensity transition will follow the ramp defined by the curve during its fade. This value is determined by referencing the output value of the curve at that percentage and outputting the curved level rather than the percent level. Up to 100 points of delineation can be established in a curve, each with its own intensity value if desired.
When applied to a cue, the “percent completion” of the cue is determined by applying the curve’s output level as the percent completion for all fade calculations. For single-part cues, the calculation applies only to intensity. For multipart cues, however, the curve applies to all parameters in the part.
When applied to a scroller fan, the output of the fan will be controlled by the intensity of the channel.
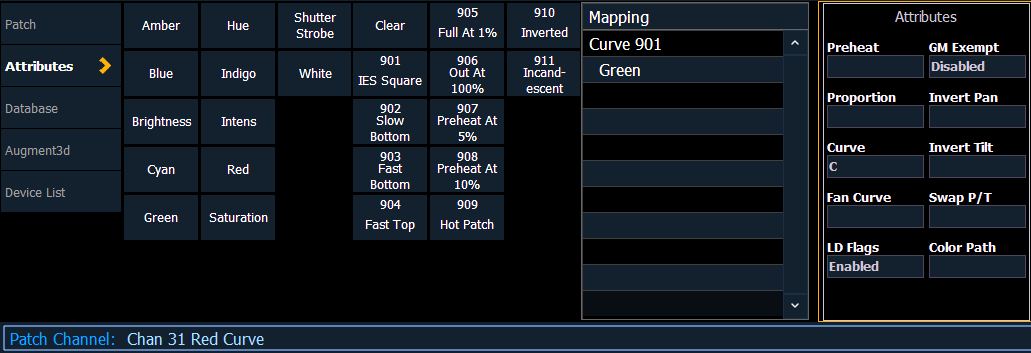
Curves can also be applied to fixtures with non-intensity parameters (NPs). When a channel with NPs is selected in Patch > Attributes > Curve, individual buttons for each available parameter will be displayed in the CIA. Click one or more buttons to apply a curve to the desired parameter(s).
Eos provides 11 pre-programmed, commonly used curves. They can be edited or copied to a new curve location. When a pre-established curve is deleted, it will return to its original state.
The curve editor can be accessed by pressing [Tab] [2] [1] or [Displays] {Curve} or from the browser, Browser > Record Target Lists > Curves. When selected, the curves list will open as a separate tab and the CIA will show the graphical output of the first curve in the list.
You can scroll through the list using the [Next] and [Last] keys, or you can specify a curve in the command line.