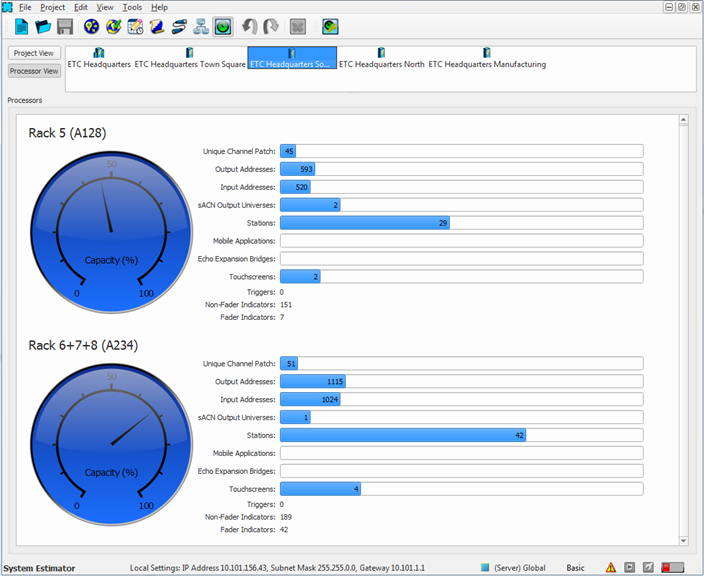
The gauge graphic provides an overall estimation of the key object and resource limitations against the capacity of the selected Central Control Server or Paradigm processor(s).
When the key objects and resources are within their own limitations and within the capacity of the Processor they are assigned, the gauge displays in blue. As the objects and resources assigned are pushing their limits, the gauge and bar graph will display in red.
The bar graph to the right provides real-time data of the key object resources (parameters) that are assigned. The bar graph for each object resource is provided with an actual number of utilized resource. Hovering the mouse pointer over the bar displays a pop up window which indicates the amount of the resource used and the maximum amount allowed.
To retrieve up-to-date system data, click the [Update Estimator]![]() button in the tool bar.
button in the tool bar.