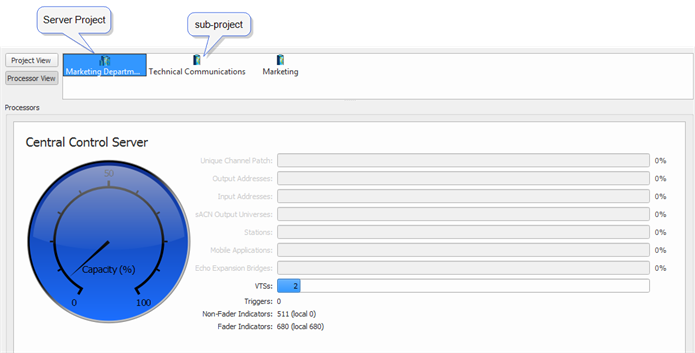
With a sub-project selected, each of the Paradigm processors in the sub-project displays with its parameters in the estimator view.
Limits specified below are for a sub-project:
-
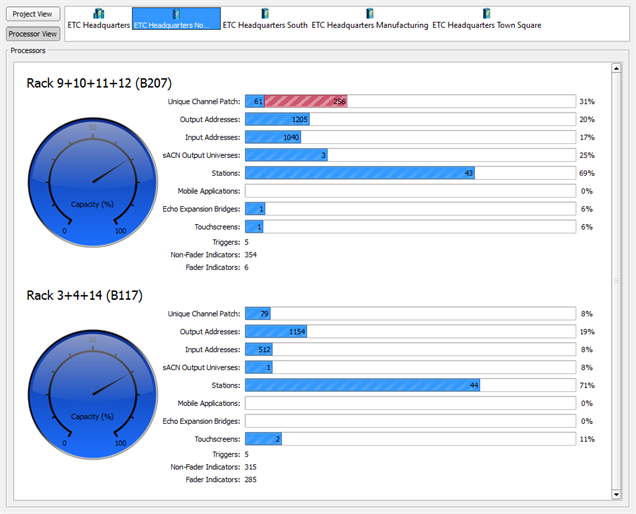
Unique Channel Patch: limited to 1,024 individual channel attributes patched to a Paradigm Architectural Control Processor (P-ACP). This bar graph indicates, using a red stripe color code, any Echo Zones that are patched to the Paradigm processor, utilizing processor channel capacity .

- Output Addresses: limited to 1,024 DMX addresses using both output ports or 6,144 using sACN.
- Input Addresses: limited to 6,144 addresses.
- sACN Output Universes: limited to 12. This could be limited to 10 when DMX ports are at the maximum Output Addresses.
- Stations: limited to 62 control stations (this count is affected by connected LON LCD stations and Mosaic Show Controller Integration).
- Mobile Applications: limited to 16 per Paradigm Processor maximum
- Echo Expansion Bridges: limited to 16 per project maximum
- Touchscreen's: limited to 18 touchscreen stations, including wireless Handheld Touchscreens, per Paradigm processor (up to 6 can be LinkConnect).
- Triggers: limited to 1,024 triggers
- Non-Fader Indicators: limited to 65,535 non-fader indicators
- Fader Indicators: limited to 65,535 non-fader indicators