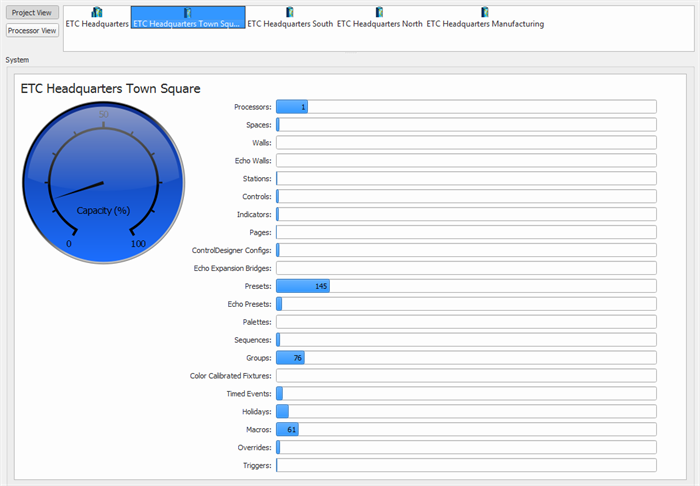
The bar graph to the right of the gauge provides real-time data of the key objects and resources that are in the project.
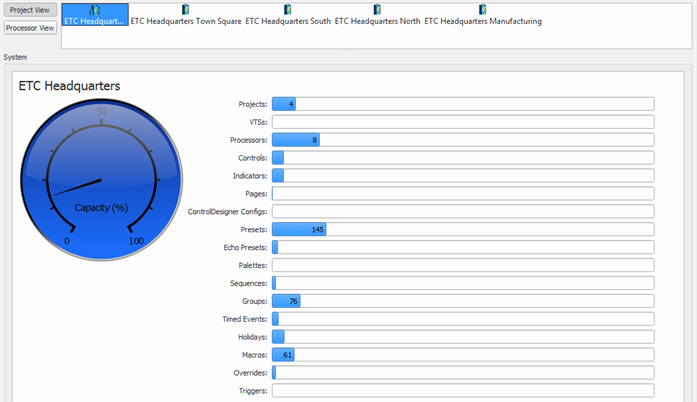
Limits specified below are system limits for the selected Server Project:
- Projects: limited to 64 sub-projects max
- VTSs: limited to 32 max
- Processors: limited to 64 Paradigm Architectural Control Processors max
- Controls: limited to 65,535 controls max
- Indicators: limited to 65,535 indicators max
- Pages: limited to 65,535 pages max
- ControlDesigner Configs: limited to 32 max
- Presets: limited to 1,024 max
- Echo Presets: limited to 2,048 max
- Palettes: limited to 1,024 max
- Sequences: limited to 512 max
- Groups: limited to 1,024 max
- Timed Events: limited to 4,096 max
- Holidays: limited to 1,024 max
- Macros: limited to 1,024 max
- Overrides: limited to 1,024 max
- Triggers: limited to 1,024 max