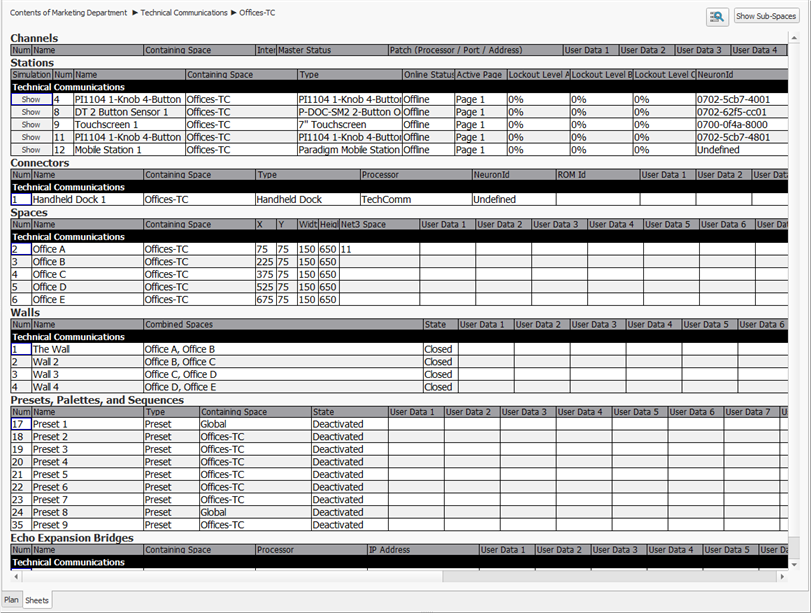
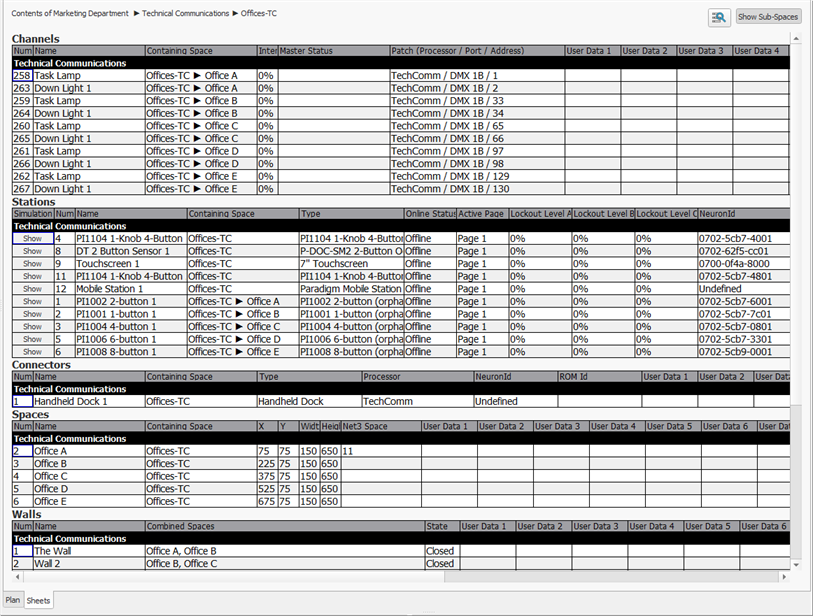
The Sheets tab is an editable spreadsheet view of all contents in a selected space including; channels, stations, connectors, Echo Expansion Bridges, spaces, walls, presets, palettes and sequences. The Sheets tab is available in both the Design and Program/Simulate views, although the data displayed and editable in each view will vary according to the selection. Only certain data can be edited from the Sheets tab, even with advanced user level access.
To view the Sheets tab, first select the desired space or subspace from the Browser, and then switch from Plan to the Sheets tab. The data displayed in the Sheets tab directly represents the contents of the selected space (Primary, Sub-Space, Project, or Server Project).
Tip: Expand the Find and Replace controls to find and replace text in the Sheets view. See Find and Replace for more information on its use.
The selected space is identified in a breadcrumb trail found on the header row of the Sheets tab.
This breadcrumb can be set to show the entire space hierarchy or not by enabling or disabling the Spaces feature in Objects Preferences.
Click anywhere in the row of data to select an object. Object selection tracks within the Browser and the Property Editor populates with the selected objects properties. An editable cell of data outlines in red (selection color is a preference setting) while a cell of data that is not editable will highlight with selection, but will not have an outline and will not be editable.
To edit object properties in the Sheets tab, such as the Name or Processor assignment, double-click in the cell. The data displayed as well as the data that is editable will differ depending on the application view.
Example: In Design view, the editable data for a Channel is the channel Num, Name, Fixed Load*, Light Source Load*, and Net3 Circuit* are editable. (*Present and editable only when Energy Management is enabled for the Server Project.)
For that same channel in the Program/Simulate view, Intensity is editable.
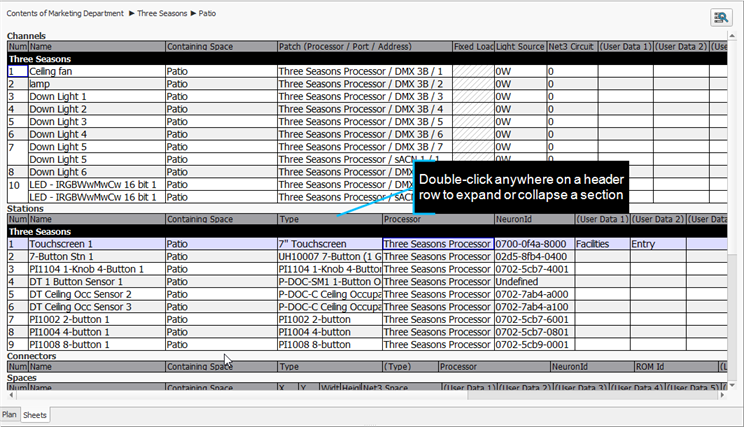
From within the Sheets tab you can expand or collapse data sections by simply double-clicking inside the header row of the section. Alternatively, you can right click on a section header and select either "Collapse" or "Expand" from the context menu.
Example: For example, to collapse the Stations data section, double-click anywhere in the header row.
Repeat to expand the section.
From the Sheets tab you can show or hide sub-spaces from the "Spaces" section of the spreadsheet by toggling the [Show Sub-Spaces] button located on the top right corner of the Sheets page.
This feature is available only with a Primary Space selected.
From the Sheets tab you can sort the spreadsheet data by selecting up to two user defined sorting values, primary and secondary.
Right-click in any column header row such as, "Num" or "Name" for instance, and select "Set primary sort" from the context menu. The data in the spreadsheet will sort by that column data. You can add an additional level to the spreadsheet by setting a secondary sort to a different column.
Tip: The single arrow head icon next to the Name column indicates the Primary Sort. A column assigned to a secondary sort will display a double arrow head.
To clear a sort, right-click on the header and select "Clear..." from the context menu.
From the sheets tab, in either the Design or Program Simulate views, you can choose to show or hide User Data (object metadata in basic terms) in the spreadsheet. By default, User Data is hidden.
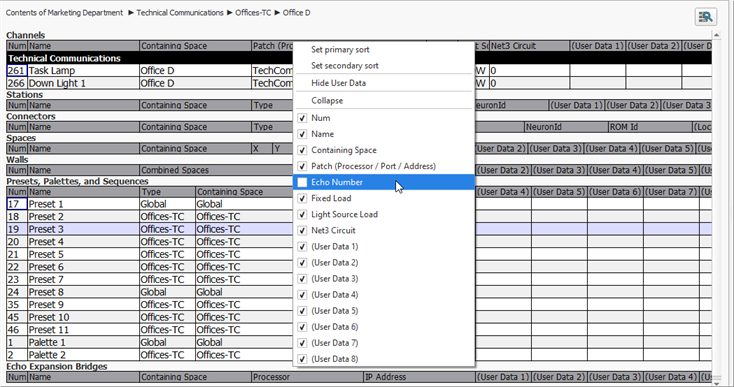
To display User Data, right click on any header row in the Sheets tab and select "Show User Data" from the context menu.
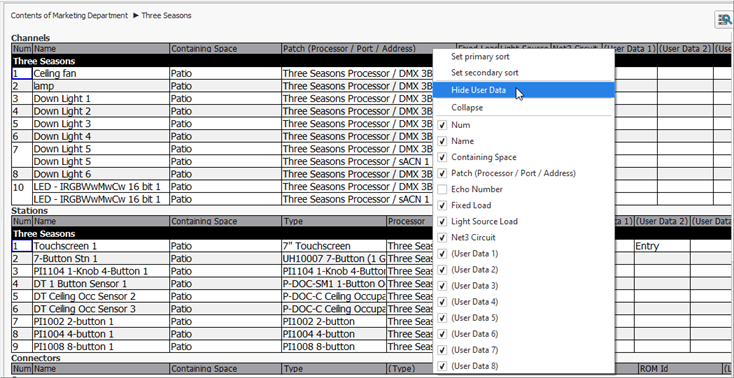
Tip: The columns of User Data may have a different column label than the defaults of (User Data 1), (User Data 2), etc. Users are provided the ability to customize each object type user data tags to assist when creating Smart Folders, organizing the data, etc. All user data fields will display in Sheets and exported views in parentheses (your text here) for visual indication.
User Data fields will display for all object types in the Sheets tab, and will remain enabled even when toggling between the Design or Program/Simulate views. To hide the User Data columns from the Sheets view, right click on any header and select "Hide User Data" from the context menu.
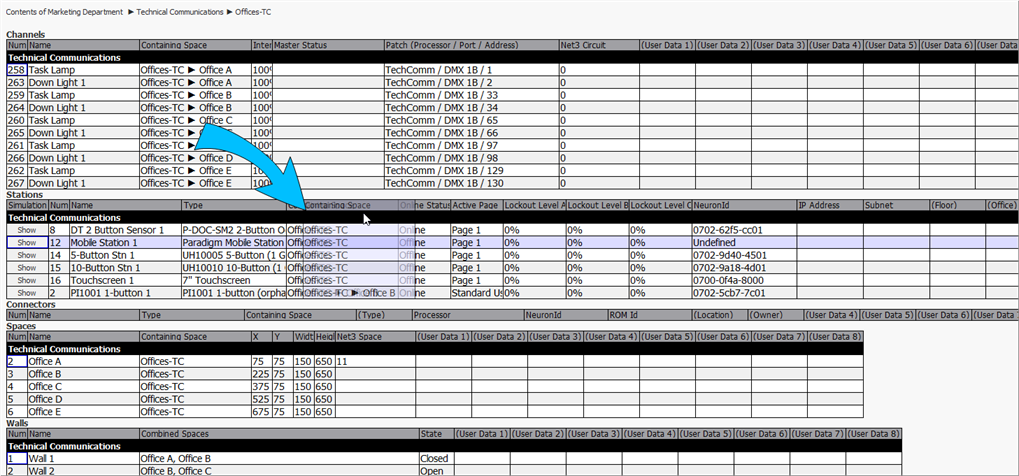
From the Sheets tab you can rearrange the displayed column data by moving them to a new order, changing the column width, and you may show or hide specific columns from the view.
Each data type is separated into sections within the Sheets view. Within each section, column headers that are specific to that data type are displayed. You can rearrange the columns from their default order as desired. Simply click ahd drag the column header into the new location within that section.
The new column order displays in the Sheets view for both Design and Program/Simulate application views.
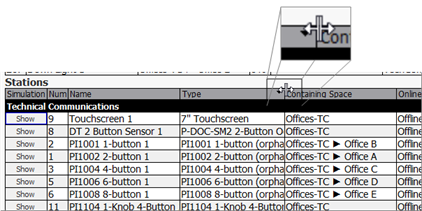
From the Sheets tab, either Design or Program/Simulate view, you can change the column width.
Place the mouse pointer on the line between columns in the column header. The pointer will change to a double headed arrow.
Click with the left mouse button and drag the double headed arrow to the right to widen a column or to the left to make the column narrower.
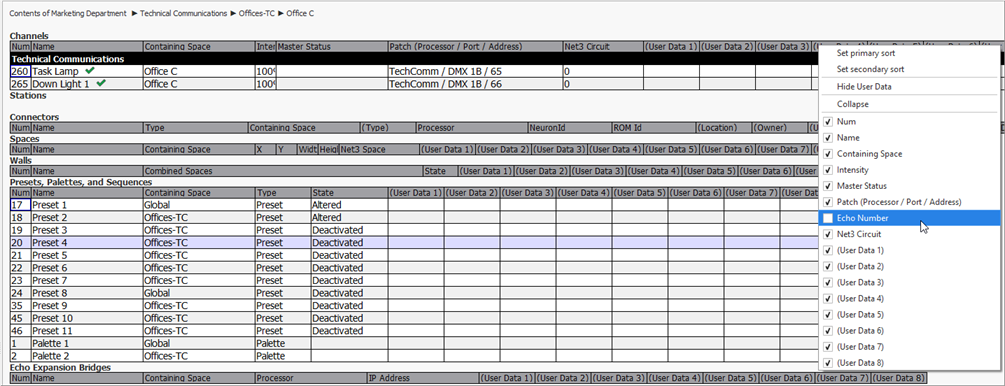
Each data type is separated into sections within the Sheets view. Within each section, column headers that are specific to that data type are displayed. You can show or hide columns of data from the spreadsheet as needed by right clicking inside the header and deselecting the column header name to be hidden from the options shown in the context menu.
The column data show/hide settings persist in the Sheets tab for both the Design and Program/Simulate views.
Tip: The available columns of data for each section may differ depending on the view, Design or Program/Simulate. For example, the Stations section in the Design view will not have a Simulation setting, but the Program/Simulate view will.
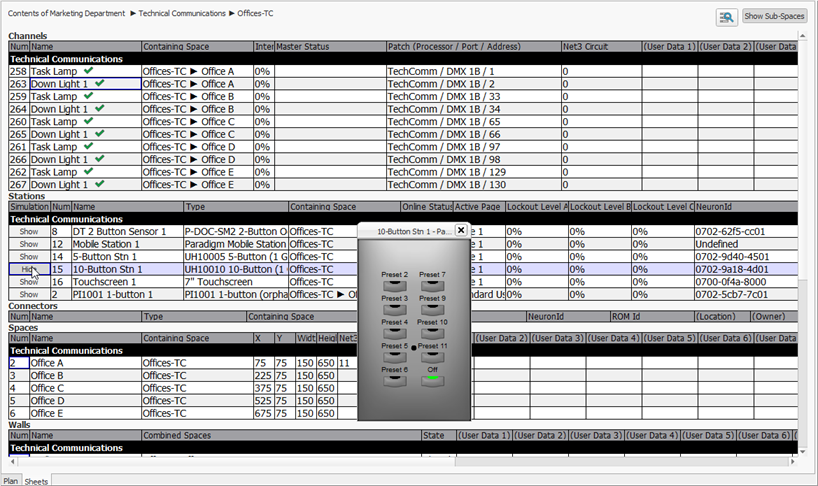
The Sheets tab, similar to the Plan tab, also provides the ability to view a station in simulation while in the Program/Simulate view.
Simply click the [Show] button next to the station in the spreadsheet to display the station in simulation. Click a preset button on the station to activate that preset; all affected channels for that preset will update in the spreadsheet and in real time if you are also in "Live Control".
To hide the simulated station, click [Hide] or click the [X] button on the simulated station image.