Create or Edit Report
Log messages are the historic data about events in the system and are stored on the connected Net3 Conductor. Use the Log Reporting feature in Concert to create, edit, run or delete a log report. Log reports are stored as part of the configuration; they can be recalled, run, and edited as needed.
Note: The Log Reporting feature is available only if the Net3 Conductor is detected on the network.
Creating a new log report and editing an existing log report are very similar in process, they are managed through the Log Report Wizard. The Log Report Wizard is provided to manage the setup and configuration of the log data including the selection of which space to retrieve log data, specific devices in the selected space, the type of messages to retrieve, determining a date and time range, as well as limiting the number of returned messages. Since log messages are categorized according to how severe the error is, an additional selection of which errors should be retrieved is also provided.
Log Report Wizard
Follow these steps to create or edit a log report in the Log Report Wizard:
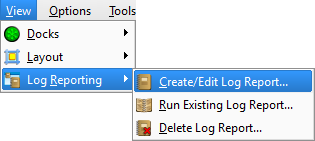
- Get started by selecting Create/Edit Log Report from the Log Reporting sub-menu in the View menu.
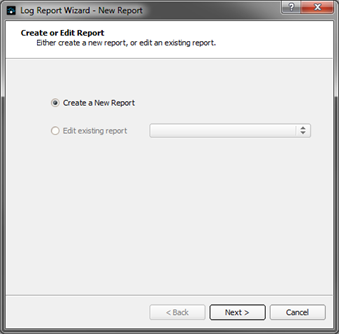
- The Log Report Wizard - New Report dialog displays. When there are no existing reports for the configuration, Create a New Report is the only selection available. When you are editing an existing report, select the report name from the Edit existing report drop-down field.
- Click Next to continue. The Name and Devices page is displayed for specification of log report details. When editing an existing report, the existing report specifications display for edit.
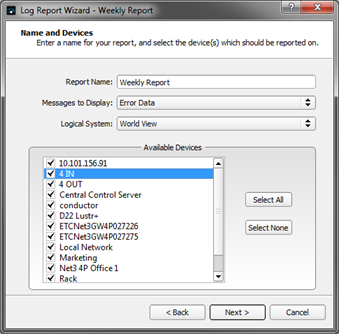
- Enter a name for the report in the Report Name field. This name will be used as the log report name if you decide to save it for future use. The report name is limited to 32 characters in length.
- Select the types of messages to display from the available selections:
- Error Data: The report will display errors logged from the selected devices in the selected logical system.
- All Log Data: The report will display all log data from all devices in the configuration. The Available Devices section is no longer be editable when this option is selected, as all device errors will display in the report.
- If Error Data is selected, specify the Logical System from which the device errors are retrieved.
Note: Report data is scalable and can include all devices in the world view, or any parent logical system, or a specific sub-system of a parent logical system. When determining the system selection, keep in mind that selecting a parent logical system will include error data of its sub-systems. Selecting a sub-system includes only the error data from that sub-system.
- The devices that display in the Available Device section are dependent on the logical system selected. Select the device(s) which should be reported on from the devices shown. By default, all devices are selected. To remove specific devices, deselect the check boxes corresponding to the devices. To remove all devices, click Select None.
- Click Next to continue. The Select Time Range page displays for specification of the date range and the limit for the amount of results to return.
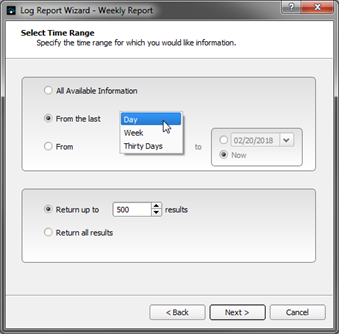
- Select the date range from the available options.
- All Available Information: Returns all the information available on Net3 Conductor for the selected device errors in the selected logical system.
- From the last: Select one of the following from the drop-down field
- Day: Returns information from the previous 24 hour period until the current time
- Week: Returns information from the previous seven days up until the current time (168 hours).
- Thirty Days: Returns information from the previous 30 days, including the current day
- From: Allows specific date range selection.
- Specify the range start date. The start date format is based on the location of the host computer. For example, dd/mm/yyyy for the UK and mm/dd/yyyy for the USA.
- Specify the range end date. The end date can be a specified date, or select the "Now" radio button to include all messages from the range start date until the current time.
- Select the quantity of messages that can be returned from the available options.
- Return up to: Enter the maximum number of messages to return. Default value is 500, but can be any amount between 1 and 3,000.
- Return all results: Returns all data without a limit on the message count.
CAUTION: Selecting Return all results may result in a slow report generation as the data amounts may be high.
- Click Next to continue. The Severity and Verbosity page displays for specification of which level of error messages you want returned in the log report.
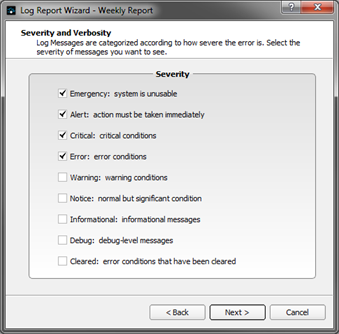
- Log messages are categorized according to how severe the error is. Select the severity of messages you want returned in your log reports from the available options. By default, Emergency, Alert, Critical, and Error are selected as these error types are deemed the most important. Change the selection if desired. Items with a check mark will be included in the report.
- Click Next to continue. The Save Report page displays for selection of what you would like to do with the new generated report.
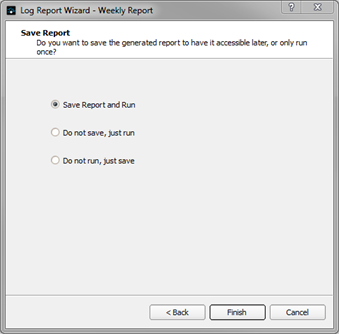
- Select one of the following options and click Finish.
- Save Report and Run: The report saves to the configuration and can be regenerated later using the Run Existing Log Report from the View menu. The report generates the log file and displays as a new tab in the workspace .
- Do not save, just run: The report generates the log file and displays as a new tab in the workspace.
- Do not run, just save: The report saves to the configuration and can be generated later using the Run Existing Log Report from the View menu.
Reference Working with Logs. Logs can be exported to a comma separated value (CSV) format document for use with external spreadsheet applications such as Excel.