Five types of objects can be added to a plot: fixtures, gangs, PixelMaps, show items and shapes. In this section we will review how to add, remove, and edit these different types of objects.
To add fixtures to a plot:
Open the plot (Pig + Fixture, #, Open)
Enable the fixture edit button at the top of the plot window.

Click the add fixtures tab of the properties pane located on the right side of the plot window.
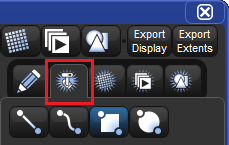
If you are adding multiple fixtures then use the buttons listed under the add fixtures tab to choose a gang arrangement.
Make a fixture selection.
Touch (or left click) and drag across the plot window to add the fixtures.
The fixtures are now added to the plot using the selected gang type.
To remove fixtures from a plot:
Enable the fixture edit button at the top of the plot window.
Select the fixtures in the plot you wish to remove (fixture selection can either be done directly in the plot window or by using the command line or groups).
Press the Delete button in the properties pane located on the right side of the plot window.
To edit a fixture (change its properties):
Enable the fixture edit button at the top of the plot window.
Select the fixture(s) you wish to edit.
Use the properties pane located on the right side of the plot window to adjust the fixture's position and/or rotation, icon type/size, and color-coding. You can also reposition a fixture by using the mouse or touchscreen to click and drag the fixture into position. Note: fixtures that are attached to gang must first be detached (dragged off the gang) in order to be custom positioned. Also be aware that changing the icon or color-coding for a fixture in one plot will change the assigned icon and color-coding for that fixture in all plots as this property is shared show-wide.
Gangs are collections of fixtures arranged in geometrical shapes. Gangs can be resized, rotated, and also have several options for how the fixtures are ordered within the gang. In this section we will review how to edit and delete gangs.
To remove a gang:
Enable the gang edit button at the top of the plot window.

Select the gang you wish to delete.
Press the Delete button in the properties pane located on the right side of the plot window; the gang and all the fixtures attached to it will be deleted from the plot.
To edit a gang (change its properties):
Enable the gang edit button at the top of the plot window.
Select the gang you wish to edit.
Use the properties pane located on the right side of the plot window to adjust the gang's position, size, fixture layout, fixture ordering, etc...). You can also reposition the gang by using the mouse or touchscreen to click and drag the gang into position. Similarly, you can resize and rotate the gang using the blue object handles that appear when the gang is selected (circle handle for gang rotation / square handle for gang sizing).
PixelMaps are rectangular plot objects which can be used to map the pixels of rich media content (photos and videos) onto lighting fixtures through a process known as PixelMapping. In this section we will discuss how to add/remove PixelMaps in plots. For more detailed information on PixelMapping refer to section 20.4.
To add a PixelMap:
Enable the PixelMap edit button at the top of the plot window

Click on the add PixelMap tab of the properties pane located on the right side of the plot window
Touch (or left click) and drag across the plot window to draw a pixel map
To remove a PixelMap:
Enable the gang edit button at the top of the plot window.
Select the gang you wish to delete.
Press the Delete button in the properties pane located on the right side of the plot window.
To edit a pixelmap (change its properties):
Enable the PixelMap edit button at the top of the plot window.
Select the PixelMap you wish to edit.
Use the properties pane located on the right side of the plot window to adjust the PixelMap's position, size, rotation, and layer assignments). You can also reposition the PixelMMap by using the mouse or touchscreen to click and drag the PixelMap into position. Similarly, you can resize and rotate the PixelMap using the blue object handles that appear when the PixelMap is selected.
Show items such as lists, scenes, and views can be added plots and are displayed similar to how they are shown in their native directory window. Once a show item is added to a plot it can be executed in the plot by pressing on it. If the pig key is held when a show item is pressed in the plot window then the show item will not execute but rather token its name onto the command line allowing for even more complex operations (similar to guard in the directory window).
To add a show item to a plot:
Enable the show item edit button at the top of the plot window.

Click on the add show item tab of the properties pane located on the right side of the plot window.
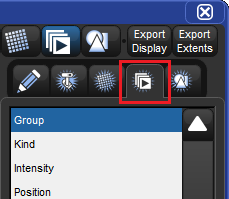
Use the dropdown menus to pick the show item you wish to add to the plot.
Touch (or left click) and drag across the plot window to draw the show item into the plot.
To remove a show item from the plot window:
Enable the show item edit button at the top of the plot window.
Select the show item you wish to delete.
Press the Delete button in the properties pane located on the right side of the plot window.
To edit a show item (change its properties):
Enable the show item edit button at the top of the plot window.
Select the show item you wish to edit.
Use the properties pane located on the right side of the plot window to adjust the show item's position, size, rotation, and the actual show item it is linked to.
Shapes are simple plot objects that have various fill and outline options and can also display text. The supported image formats for filling shapes include JPG, PNG, BMP, and TIFF. In this section we will discuss how to add/remove and edit shapes in plots.
To add a shape to a plot:
Enable the shape edit button at the top of the plot window.

Click on the add shape tab of the properties pane located on the right side of the plot window.
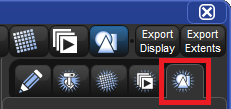
Touch (or left click) and drag across the plot window to draw a default rectangle shape.
Once the default rectangle shape is added to the plot it can be changed to any shape using the properties pane located to the righ of the plot window.
To remove a shape:
Enable the shape edit button at the top of the plot window.
Select the shape you wish to delete.
Press the Delete button in the properties pane located on the right side of the plot window.
To edit a shape (change its properties):
Enable the shape edit button at the top of the plot window.
Select the shape you wish to edit.
Use the properties pane located on the right side of the plot window to adjust the shape's position, size, rotation, fill color, border color (this also affects the label color), label, image assignment, etc. You can also resize and rotate the shape using the blue object handles that appear when the shape is selected (circle handle for rotation / square handle for resizing from center / _| handle for resizing from the top left corner).
To assign a fill image to a shape:
Enable the shape edit button at the top of the plot window.
Select a shape to edit.
Press the "select" button in the properties pane for the "image" attribute.
An Image File dialogue box will appear. Select an image from the list of images and press okay. If images are not listed in the Image File dialogue box then proceed to Importing Images from a USB Flash Drive for details on how to import images into the show.
To import an image file from a USB Flash drive into the image file list:
Use a personal computer to copy the image file you wish to import to an external USB flash drive.
Insert the USB flash drive into the console.
Click on the "Import Image File" button at the top of the Image File dialogue box.
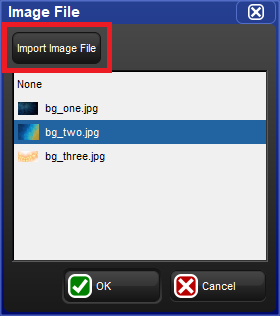
Browse to the external USB flash drive and select an image to import. Press to confirm.
The image has now been imported and is available for assignment to image rectangles for all plots in the show unless the image is manually deleted using the right click menu in the Image File dialogue box.
This section will cover some handy shortcuts and tips for editing multiple plot objects at once. These tips can help you to build complex plots more quickly and symmetrically.
To equalize the properties of multiple plot objects:
First select a plot object that has a property value that you want to apply to other objects in the plot (for example, you may want to align objects to have the same X position as one of the objects already in the plot)
Now select the plot objects you wish to adjust to match the first plot object you selected
Hold the / key on the front panel of the console
Press the up or down scroll button for the property you want to equalize all the selected objects to (for example, if you want all the selected plot objects to align horizontally then press the up or down arrow button for the X position property while holding the / key)
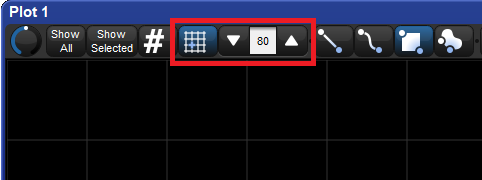
An alignment grid with customizable sizing can be toggled on/off in plot windows by pressing the grid button at the top of the plot window. To adjust the grid size change the numeric value in the scroll box located directly to the right of the grid button. When the alignment grid is enabled the center of plot objects will snap to the vertices of the plot grid when they are moved via click-n-drag. To override the snap-to-grid feature hold the Pig key when moving objects in the plot window. The position of objects does not change when the grid is toggled on/off or resized. The snap-to-grid feature only affects an object when the object is being moved.
